The spring and summer months have always been known as a very popular time for homebuyers to start the search for their dream home. This year is no different!
We all learned in school that when selling anything, you will get the most money if the demand for that item is high and the inventory of that item is low. It is the well-known Theory of Supply & Demand.
If you are thinking of selling your home, here are two graphs that strongly suggest that the time is now. Here is why…
DEMAND
According to research at the National Association of Realtors (NAR), buyer activity this year has far outpaced the same months in 2014. Purchasers who are ready, willing and able to buy are in the market at great numbers.
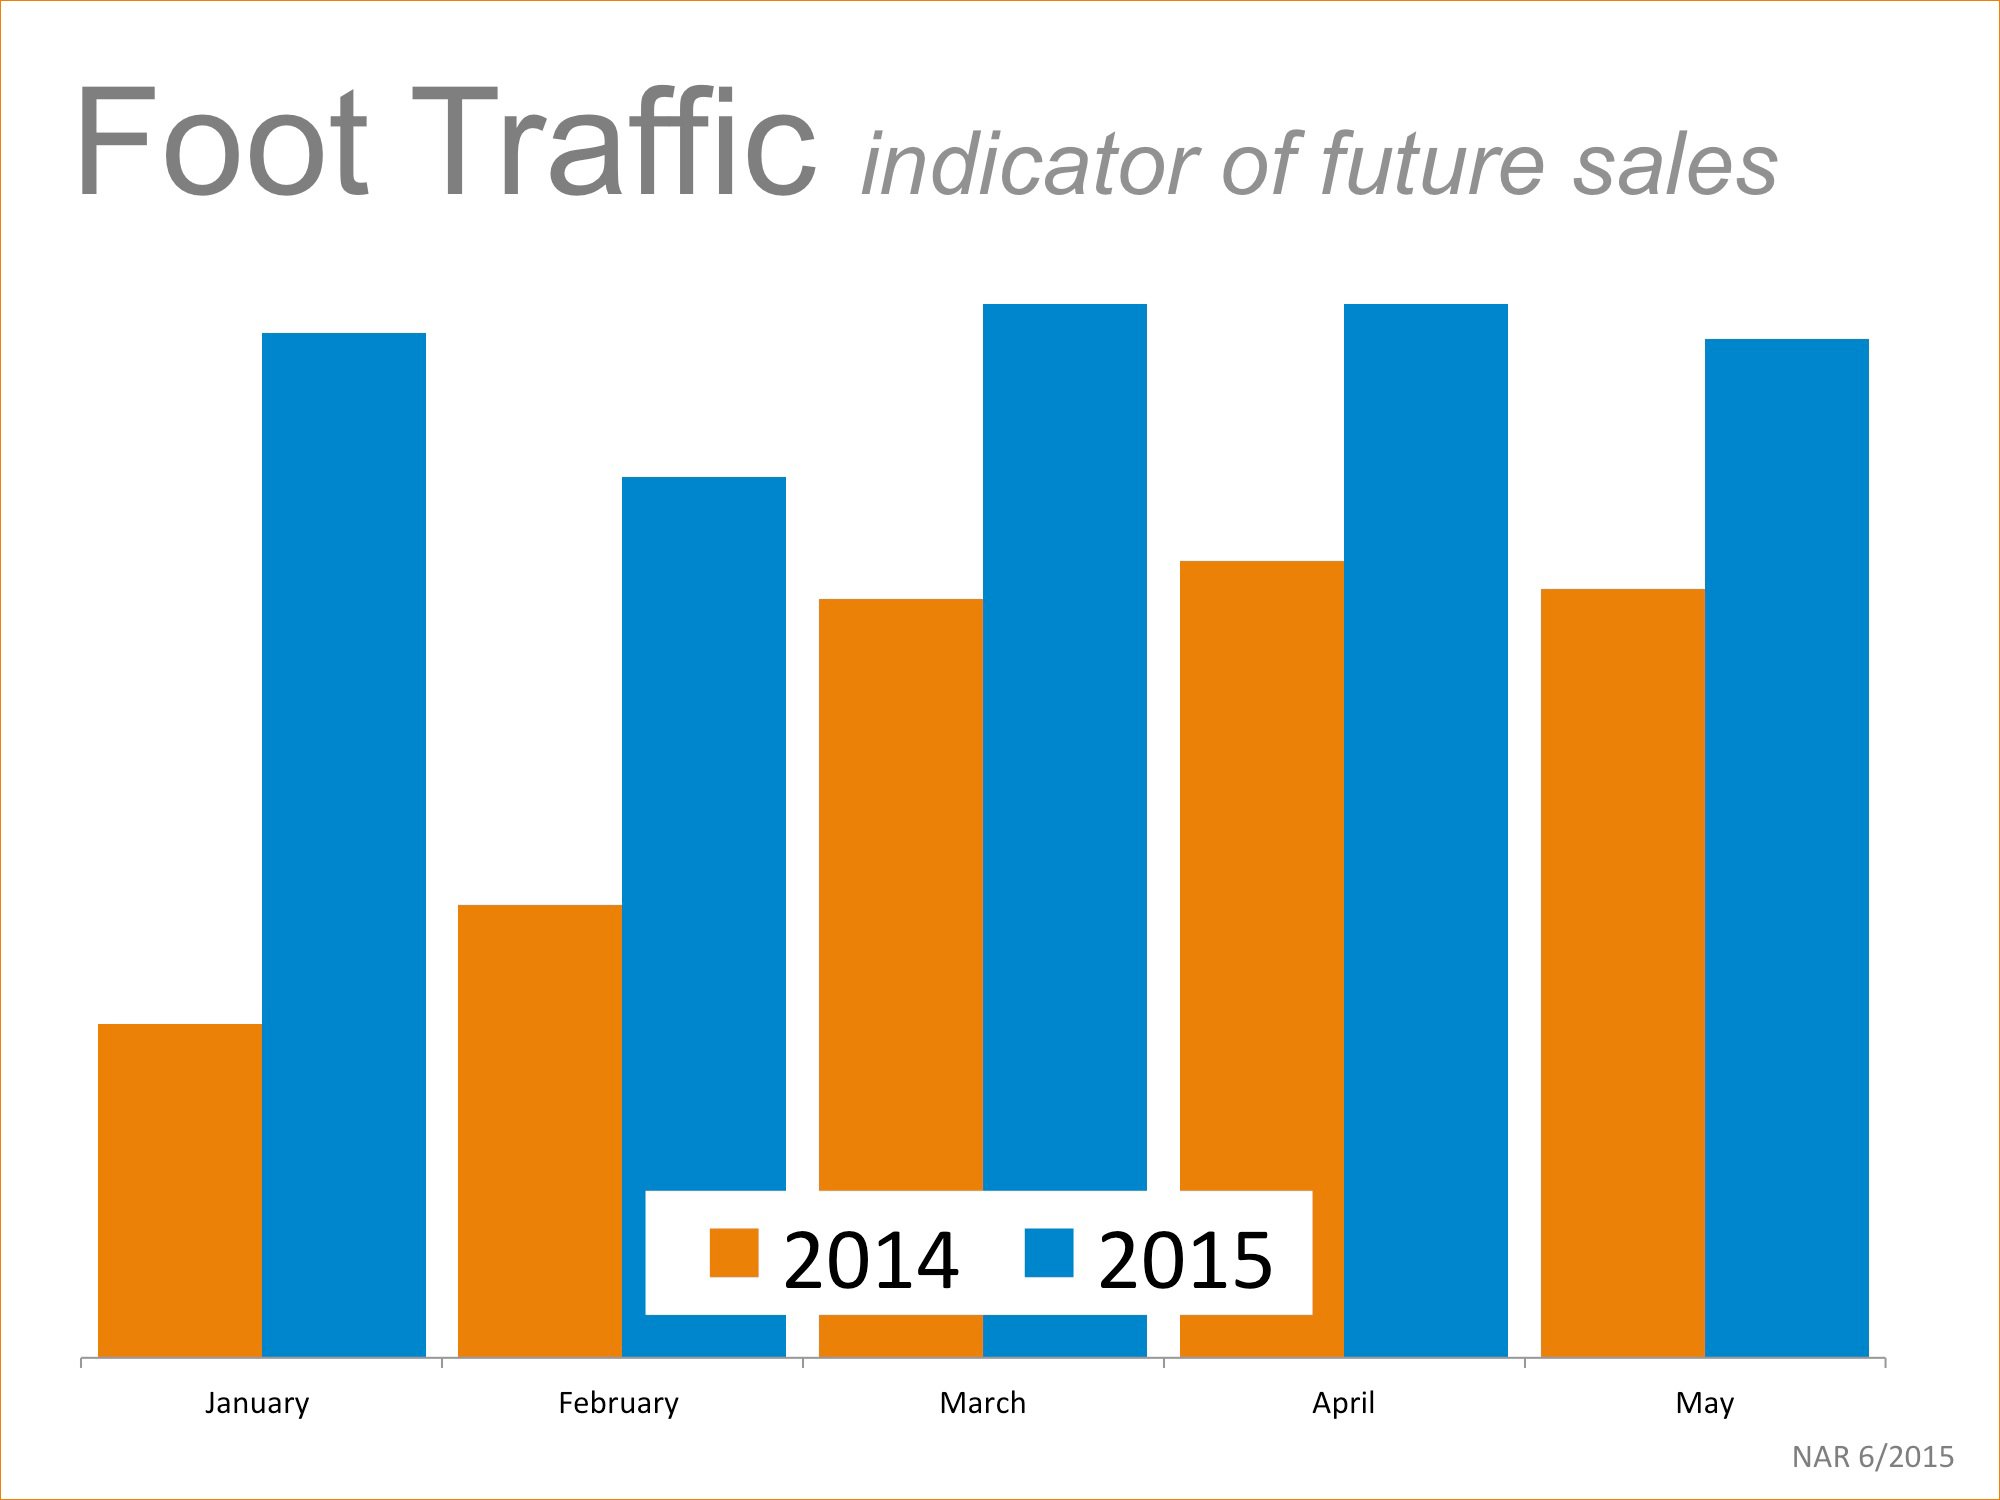
According to NAR, “Foot Traffic has a strong correlation with future contracts and home sales, so it can be viewed as a peek ahead at sales trends two to three months into the future.”
SUPPLY
The most recent Existing Home Sales Report from NAR revealed that the current supply of housing inventory is at a 5.1 month supply, which remains below the 6-months necessary for a normal market.
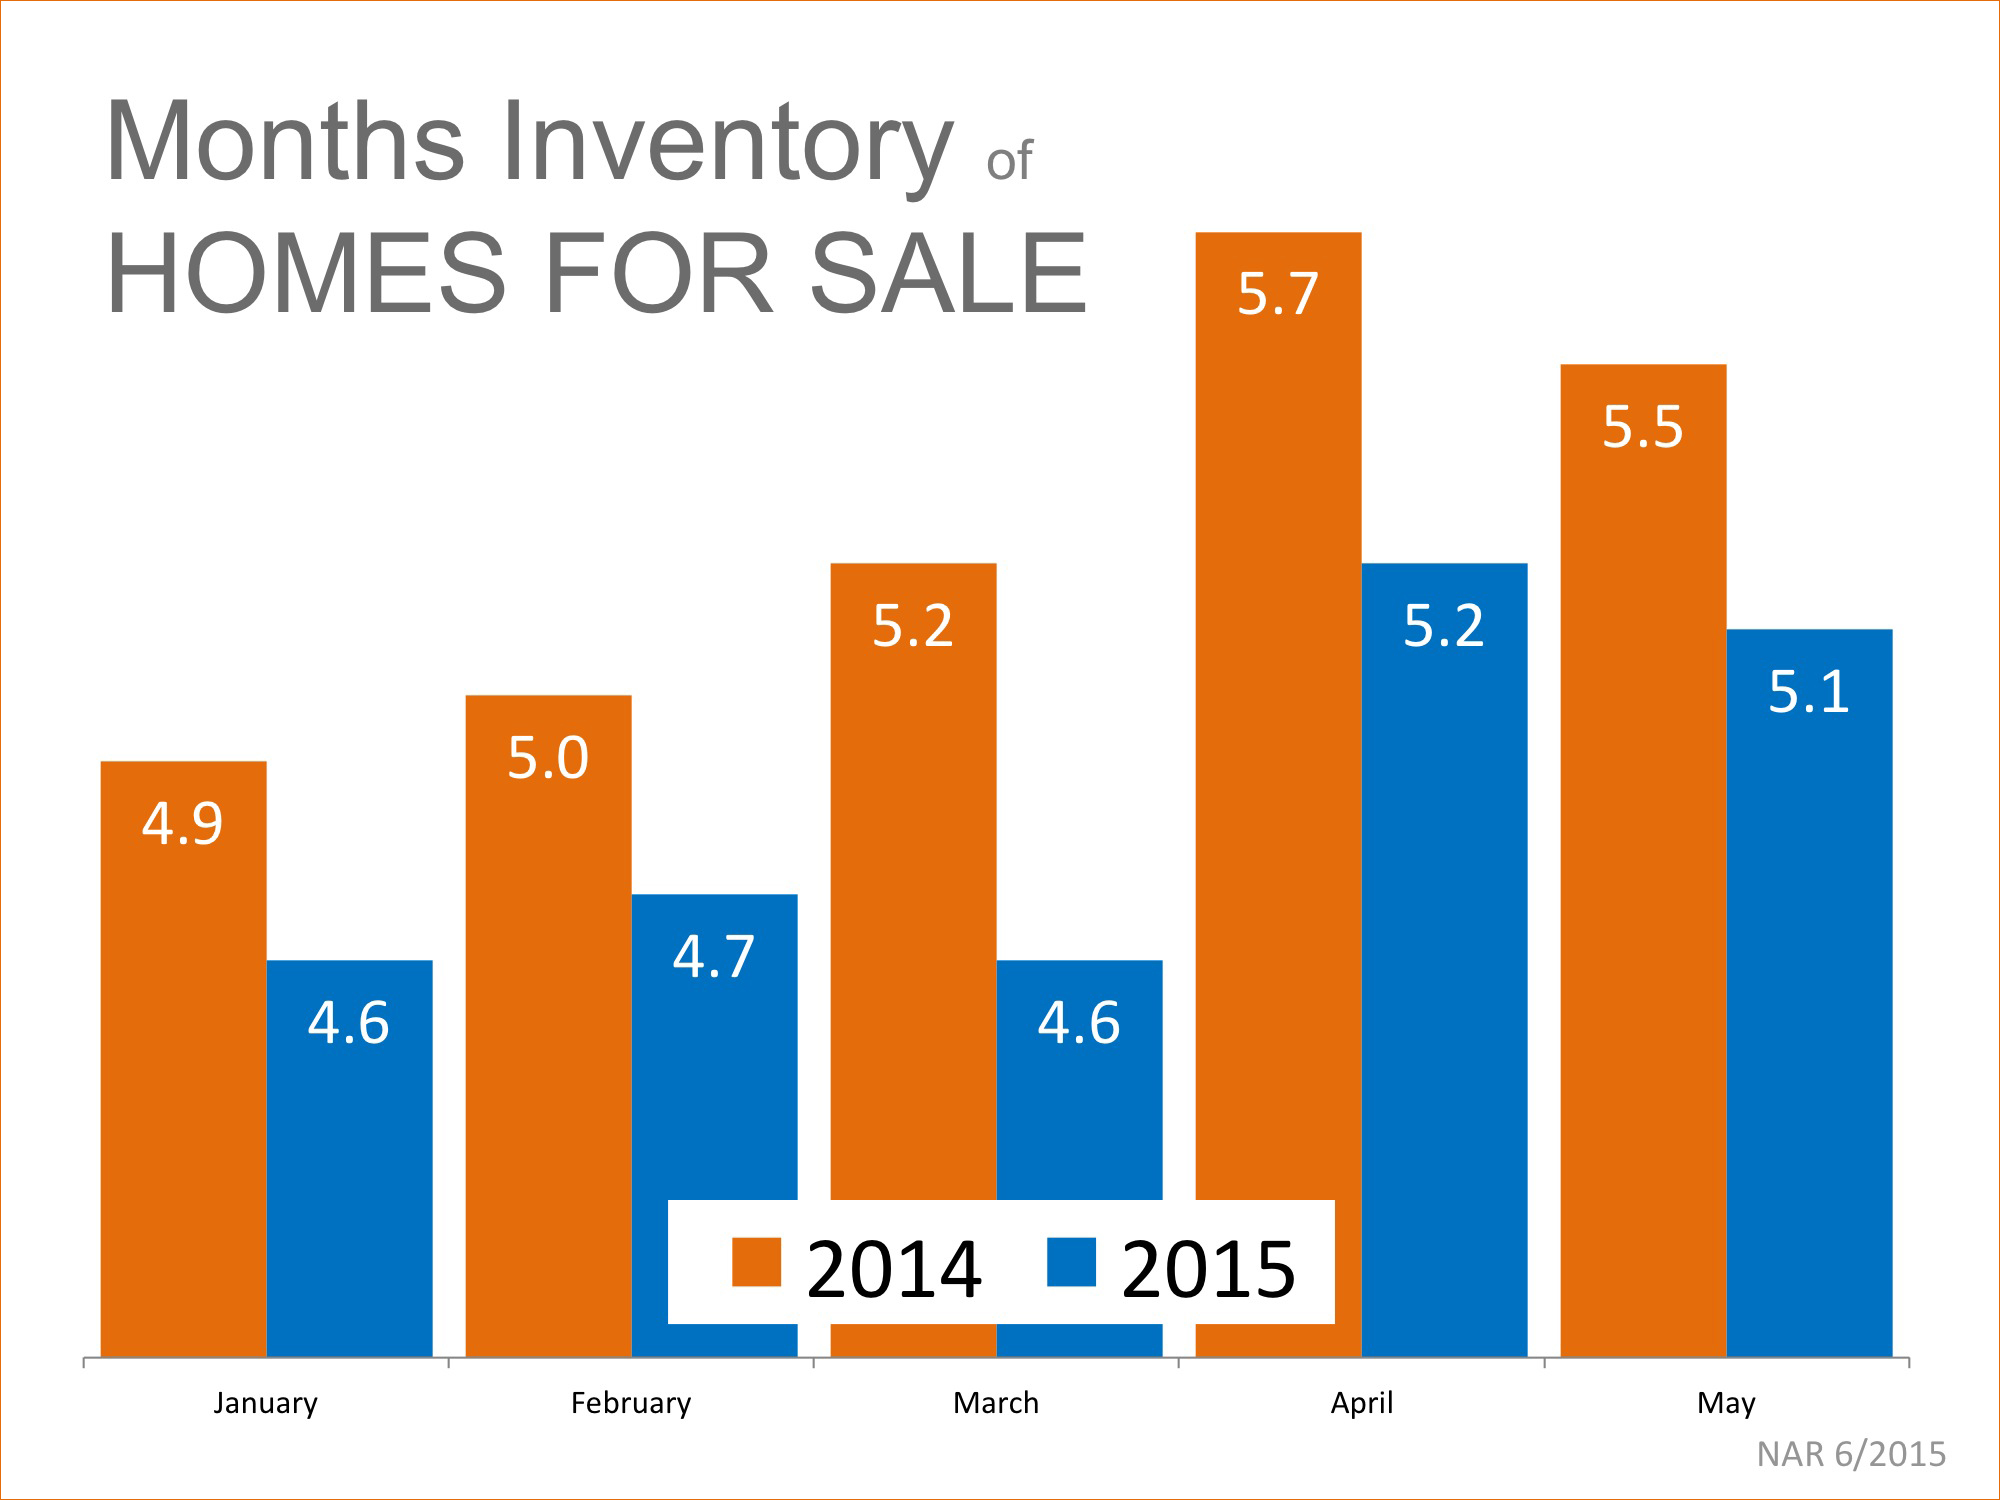
Buyer demand is far outpacing the supply of homes available for sale.
Bottom Line
Listing your house for sale when demand is high and supply is low will guarantee the offers made will truly reflect the true value of your property.